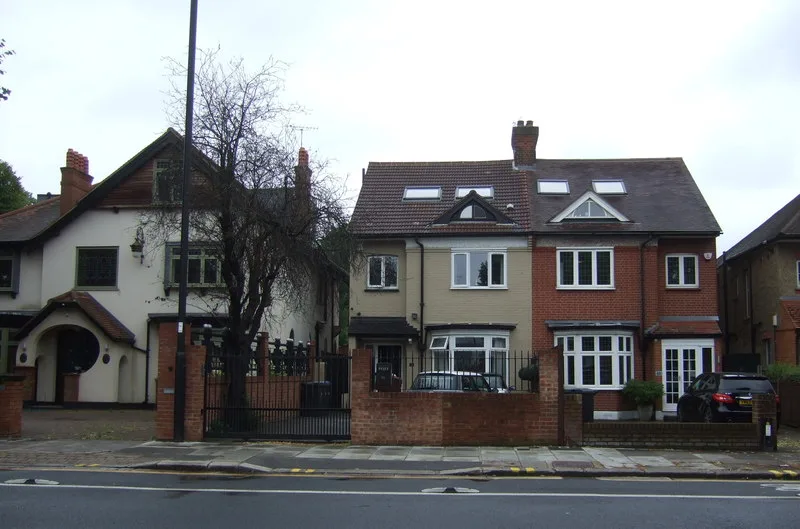

Enfield's semi-detached homes reached a record £720,969 in August. The borough average rose 1.2% in a month to £474,855, while London fell 2.2% over the year.
The average semi-detached home in Enfield was worth £720,969 in August. That is the highest figure on record for the borough, just above the £720,575 of November 2022.
The borough average for all homes rose 1.2% in the month, to £474,855. That is Enfield’s biggest one-month rise since January 2025. (HM Land Registry, UK House Price Index, Enfield)
Over the year the average is up £3,791, or 0.8%, from £471,064 in August 2025.
Houses up, flats down
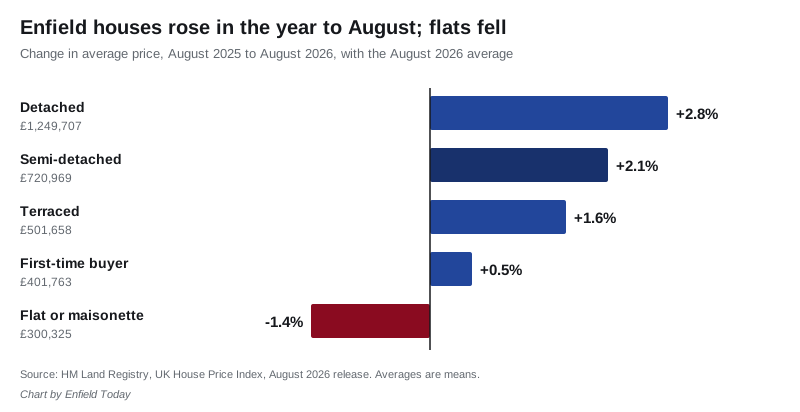
Every kind of house rose in value over the twelve months. Flats were the only faller, for the second month running.
| Property type | Average, August 2026 | Change over the year |
|---|---|---|
| Detached | £1,249,707 | +2.8% |
| Semi-detached | £720,969 | +2.1% |
| Terraced | £501,658 | +1.6% |
| Flat or maisonette | £300,325 | -1.4% |
| First-time buyer | £401,763 | +0.5% |
Terraced houses are close to a record too. Their average of £501,658 is about £1,000 below the peak of £502,708 in December 2022.
Better than most of London
Enfield’s 0.8% rise put it 7th of London’s 33 areas. Only nine rose at all. London as a whole fell 2.2% over the year, to £554,430. England rose 0.4%, to £293,525.
How the neighbours did:
| Area | Average, August 2026 | Change over the year |
|---|---|---|
| Broxbourne | £414,692 | +2.3% |
| Hertsmere | £553,008 | +1.5% |
| Enfield | £474,855 | +0.8% |
| Waltham Forest | £532,212 | +0.7% |
| Epping Forest | £530,653 | -0.3% |
| Haringey | £633,221 | -1.4% |
| Barnet | £592,892 | -4.4% |
Barnet fell furthest of the neighbours for the second month running.
The steepest falls were in central London. Westminster was down 14.3% and Kensington and Chelsea 13.8%. The biggest risers were Kingston upon Thames, up 4.9%, and Barking and Dagenham, up 4.7%.
Still below the 2022 peak
The borough’s highest average was £486,208 in December 2022. August is £11,353, or 2.3%, below that, before any allowance for inflation.
July has also been revised down. We reported July at £470,988, a rise of 0.6% on the year. The Land Registry now puts it at £469,274, a rise of 0.2%. So part of August’s jump is a rebound from a weaker July than first published.
Sales: the lowest June on record
The Land Registry counts sales two months behind prices, because the records take time to come in. The latest month is June. 138 homes changed hands in Enfield that month, the fewest in any June since the index began in 1995.
The count for the first half of the year has moved since our last report, as late registrations came in:
- January to May 2026 now stands at 758, up from the 681 we reported in September. That is the third lowest for those months since 1995, behind 2020 (715) and 2009 (735). It is no longer the lowest.
- January to June 2026 is 896. That is also third lowest, behind 2020 (870) and 2009 (884).
These counts will move again as more sales are registered.
One technical point. The UK House Price Index average is a mean, not a median. A few large sales in Hadley Wood or Winchmore Hill pull it up in a way a median would not.
What it means for you
If you own a semi, the index says it has never been worth more on average. Your own home’s value depends on the street and the house, not the borough figure.
If you are buying a flat, it is still the one part of the market that is falling: down 1.4% over the year, to an average of £300,325.
If you are a first-time buyer, the average first-time purchase in Enfield was £401,763 in August, up 0.5% on the year.
If you are selling, prices are firm but buyers are few. June’s sales were the lowest for that month in more than 30 years.
Our Enfield house prices page breaks the borough down by postcode district. The Enfield council tax bands page has this year’s charge for every band.
Sources
- HM Land Registry, UK House Price Index, Enfield
- UK House Price Index full data file, August 2026 release, for the neighbouring areas, the London ranking, the record highs and the sales counts
Have your say