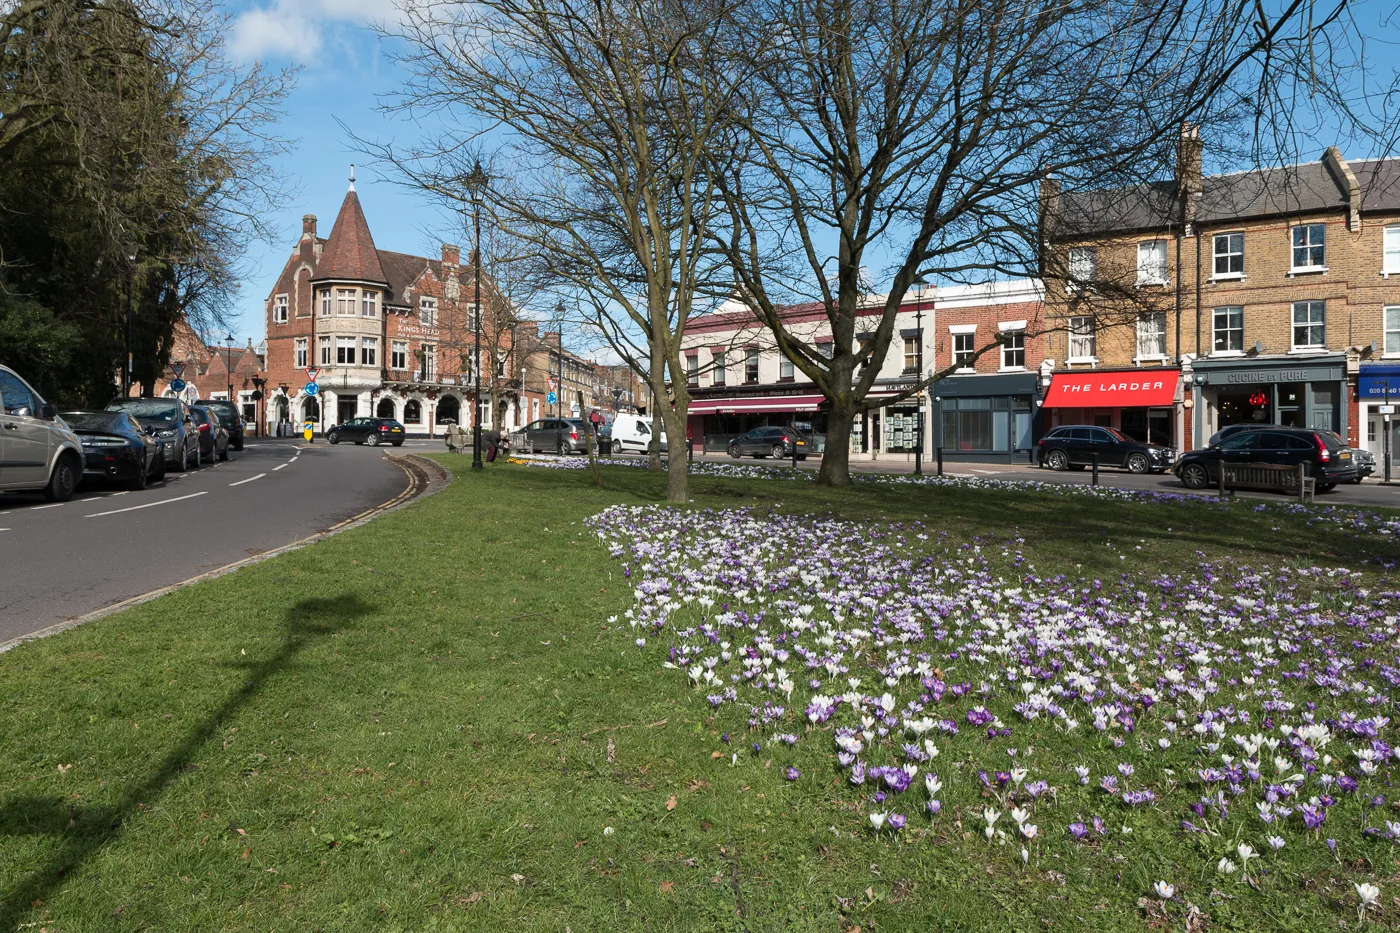

The average Enfield home sold for £470,988 and the middle sale was £447,085. Medians for Enfield Town, Southgate, Winchmore Hill, Edmonton and Ponders End.
Asking prices are what sellers hope for. What counts is what homes actually change hands for, and every completed sale in England and Wales is recorded by HM Land Registry and published. This page reads those records for Enfield: the official borough average, what it hides, and what the middle home sold for in Enfield Town, Southgate, Winchmore Hill, Palmers Green, Ponders End and Edmonton.
Two things to fix before the numbers. First, the official index covers the whole borough, which runs from Hadley Wood and the green belt in the north west down to Upper Edmonton on the Haringey boundary, and those two ends are not one market. Second, Enfield sells more terraced houses than anything else: 40% of everything sold here in the last year was a terrace, against 33% flats. That makes it unusual for London, and it means the borough average behaves more like a house market than a flat market.
The headline figure
The average home in Enfield sold for £470,988 in July 2026, the most recent month published in the UK House Price Index. That is up 0.6% over the year, a gain of £2,765.
Set that against the borough’s own record and the recovery is slight. Enfield peaked at £486,208 in December 2022. Three and a half years later the average is £15,220, or 3.1%, below that peak in cash terms, and further below once inflation is allowed for. Lambeth, by comparison, is more than 10% off its peak.
Set it against the country and Enfield sits between the two. Over the same twelve months England rose 1.1% to £293,479 while London fell 3.3% to £550,037. Enfield rose while London fell, and only 12 of London’s 33 areas managed that.
One thing the price does not show is how few people are moving. Enfield registered 681 sales between January and May 2026, the lowest total for those five months in any year since the index began in 1995. We covered that in full in our July house price report.
What it means for you
If you are buying, the softness here is almost entirely in flats. Flats and maisonettes in the borough fell 1.7% over the year to an average of £298,486. Every kind of house rose: terraced 1.7% to £496,816, semi-detached 1.6% to £714,519 and detached 1.8% to £1,243,138. The cheap end of the market is falling and the family-house end is not, which is the opposite of the story in most of inner London.
If you are selling a flat, a 2022 price is not coming back this year. If you are selling a house, the index says you are slightly ahead of where you were twelve months ago, though sales are running at their slowest in three decades of records.
If you are a first-time buyer, the average first-time-buyer purchase in Enfield was £398,455 in July 2026. That is £104,976 more than the average price of any home in England.
Prices by property type
Borough averages for July 2026 from the UK House Price Index:
- Detached houses: £1,243,138. Up 1.8% over the year. Concentrated in Hadley Wood, Winchmore Hill and the Ridgeway.
- Semi-detached houses: £714,519. Up 1.6%. The house most people picture when they picture Enfield.
- Terraced houses: £496,816. Up 1.7%, and the borough’s biggest single category by sales.
- Flats and maisonettes: £298,486. Down 1.7%, the only type falling.
What each part of the borough actually sells for
This is where the borough average stops being useful.
The table below is our own analysis of 2,470 residential sales recorded in the Enfield district that completed between 1 July 2025 and 30 June 2026, taken from HM Land Registry Price Paid data. It shows the median, the middle sale, which one enormous transaction cannot distort. The borough median over that period was £447,085; the mean over the same sales was £541,694, and the £94,609 gap between those two numbers is exactly why we use the median.
A note on the postcodes. Only sales the Land Registry records in the Enfield district are counted, so the shared postcodes are trimmed to the Enfield part: N11 and N14 are shared with Barnet, N13 and N18 with Haringey, EN2 reaches into Welwyn Hatfield, and EN4 is split between Barnet, Enfield and Hertsmere. That is why the N11 row is small. It is the Arnos Grove and New Southgate sliver, not the whole postcode.
| Outcode | Mainly | Median | Sales |
|---|---|---|---|
| EN4 | Hadley Wood and the Enfield side of Cockfosters | £925,000 | 50 |
| N21 | Winchmore Hill and Grange Park | £637,500 | 234 |
| N14 | Southgate, Oakwood and Arnos Grove | £592,500 | 222 |
| N13 | Palmers Green and Bowes | £548,000 | 240 |
| EN2 | Enfield Chase, the Ridgeway, Forty Hill and Crews Hill | £540,000 | 317 |
| N11 | The Enfield side of Arnos Grove and New Southgate | £533,000 | 85 |
| EN1 | Enfield Town, Southbury and Bush Hill Park | £460,000 | 436 |
| EN3 | Enfield Highway, Enfield Lock, Ponders End and Brimsdown | £405,000 | 406 |
| N9 | Lower Edmonton and Edmonton Green | £400,000 | 303 |
| N18 | Upper Edmonton | £397,500 | 160 |
Three smaller rows are left out of the table because they are boundary slivers rather than markets: N22 (eight sales), EN8 (seven) and N17 (two).
The west, street by street
The expensive half of Enfield is the south west and the north west: Hadley Wood, Cockfosters, Winchmore Hill, Grange Park, Southgate, Oakwood and the Ridgeway.
| Sector | Roughly | Median | Sales |
|---|---|---|---|
| EN4 0 | Hadley Wood and the Enfield side of Cockfosters | £935,000 | 43 |
| N14 6 | Southgate, around Chase Side and towards Arnos Grove | £822,500 | 58 |
| N14 7 | Arnos Grove and the Palmers Green edge of Southgate | £772,500 | 32 |
| EN2 7 | Enfield Chase and the Ridgeway | £650,000 | 81 |
| N21 3 | Winchmore Hill and Highfield | £647,500 | 66 |
| N21 1 | Winchmore Hill, Grange Park and Oakwood | £638,000 | 98 |
| N21 2 | Grange Park and the Bush Hill Park edge | £620,000 | 70 |
| N11 2 | The Enfield sliver of New Southgate | £610,000 | 47 |
| N13 4 | Palmers Green, towards Southgate and Winchmore Hill | £561,000 | 111 |
| N13 5 | Palmers Green and Highfield | £555,000 | 90 |
| EN1 3 | Enfield Town and Southbury | £540,000 | 112 |
| EN1 2 | Bush Hill Park and the Town edge | £538,750 | 81 |
| N13 6 | Bowes, the Haringey end of Palmers Green | £535,000 | 39 |
| EN2 6 | West Enfield Town and Grange Park | £535,000 | 34 |
| EN2 0 | Whitewebbs, Forty Hill and Clay Hill | £502,500 | 104 |
| N14 4 | Oakwood and the Cockfosters side of Southgate | £500,000 | 107 |
EN4 0 is a different market from the rest of the borough. The Enfield slice of Hadley Wood and Cockfosters ran at a £935,000 median across 43 sales, and the 16 detached houses that sold there carried a median of £1,836,500. That single sector is more than twice the borough median.
The most expensive named street in the borough was Winchmore Hill Road, at a median of £905,000 across nine sales. Ladysmith Road followed at £635,000 across 11, and Hazelwood Lane at £630,000 across nine.
Enfield Town, the Lea Valley and Edmonton
| Sector | Roughly | Median | Sales |
|---|---|---|---|
| EN1 1 | Enfield Town centre and Southbury | £465,000 | 127 |
| EN3 7 | Ponders End and Brimsdown | £425,000 | 65 |
| N18 1 | Upper Edmonton and Haselbury | £425,000 | 87 |
| N9 9 | Haselbury and Edmonton Green | £425,000 | 99 |
| EN2 8 | The Ridgeway and Whitewebbs, north to the county boundary | £425,000 | 84 |
| EN3 5 | Carterhatch and Brimsdown | £410,000 | 124 |
| N9 7 | Lower Edmonton and Jubilee | £410,000 | 67 |
| N9 8 | Jubilee, east Edmonton towards the Lea | £400,250 | 82 |
| EN3 6 | Enfield Lock and Enfield Island Village | £400,000 | 149 |
| EN1 4 | North Enfield Town, Southbury and Whitewebbs | £391,250 | 116 |
| N11 1 | The Enfield side of Arnos Grove and New Southgate | £390,000 | 38 |
| EN3 4 | Ponders End and Jubilee | £377,500 | 68 |
| N18 2 | Upper Edmonton and Edmonton Green | £370,000 | 73 |
| N14 5 | The Enfield sliver of Brunswick Park and south Southgate | £360,000 | 25 |
| N9 0 | Edmonton Green and Lower Edmonton | £350,000 | 55 |
Three things worth pulling out.
EN3 6 is the busiest sector in the borough. Enfield Lock and Enfield Island Village carried 149 sales at a median of £400,000. If you want to know what the volume end of the Enfield market looks like, it looks like this: a mix of 1990s Island Village houses at £422,500 for a terrace and £232,500 for a flat.
N14 is two markets in the same postcode. N14 6, the Southgate and Chase Side end, ran at £822,500. N14 5, the sliver towards Brunswick Park, ran at £360,000. That is £462,500 apart inside one postcode district, and the split is largely Barnet-boundary flats against Southgate semis.
The cheapest addresses in the borough are on main roads. On streets with at least eight recorded sales, the lowest medians were Hertford Road (£263,500 across 30 sales), Baker Street (£300,000 across 11) and Fore Street (£308,000 across 11). All three are flat-heavy arterial roads.
Flats and houses: the £340,000 step
| Type | Median | Sales | Share of sales |
|---|---|---|---|
| Detached | £925,000 | 123 | 5% |
| Semi-detached | £645,000 | 482 | 20% |
| Terraced | £475,000 | 990 | 40% |
| Flat or maisonette | £300,000 | 810 | 33% |
The remaining 65 sales are recorded as “other”, a category that mixes converted and commercial property and includes at least one very large block sale, which is another reason this page uses medians.
Unlike most of inner London, Enfield is a house-buying borough: 65% of sales were houses. The step from a flat to a terrace is £175,000 borough-wide, and the step from a terrace to a semi another £170,000.
Where you make that step matters more than the step itself. A semi-detached house in N21 (Winchmore Hill) had a median of £880,000; the same house type in EN3 was £450,000 and in N9 £467,500. A flat in N9 ran at £235,000 against £360,000 in N13 and N14.
How Enfield compares
| Area | Average price | Annual change |
|---|---|---|
| Enfield | £470,988 | +0.6% |
| London | £550,037 | -3.3% |
| England | £293,479 | +1.1% |
Enfield is £177,509 above the England average and £79,049 below the London average. That is the practical summary of the borough: expensive by national standards, one of the cheaper ways into London by London standards, and holding its value better than the capital as a whole.
Frequently asked questions
What is the average house price in Enfield?
£470,988 in July 2026, according to the UK House Price Index, up 0.6% over the year. On completed sales in the year to June 2026, the median sale in the borough was £447,085 across 2,470 transactions.
Are Enfield house prices going up or down?
Slightly up, and only because of houses. The borough average rose 0.6% in the year to July 2026, but that hides a 1.7% fall in flats against a 1.7% rise in terraced houses, a 1.6% rise in semis and a 1.8% rise in detached homes. The borough average is 3.1% below its December 2022 peak of £486,208. Sales are the weaker signal: just 681 homes changed hands between January and May 2026, the fewest in those months since 1995.
Which is the most expensive part of Enfield?
EN4, the Hadley Wood and Cockfosters end, at a median of £925,000, then N21 (Winchmore Hill and Grange Park) at £637,500 and N14 (Southgate, Oakwood and Arnos Grove) at £592,500.
Where are the cheapest houses in Enfield?
N18 (Upper Edmonton) at a £397,500 median, then N9 (Lower Edmonton and Edmonton Green) at £400,000 and EN3 (Ponders End, Enfield Lock and Enfield Highway) at £405,000. By sector, the lowest was N9 0, Edmonton Green, at £350,000.
How much is a flat in Enfield?
The borough median flat was £300,000 in the year to June 2026. By postcode it ranged from £235,000 in N9 and £240,000 in N18 up to £360,000 in N13 and N14.
Where can I check what a specific house sold for?
Every completed sale in England and Wales is public. Search a street or address for free on the HM Land Registry Price Paid service.
Related
- Enfield train and tube times to London: zones, journey times and what a Travelcard costs, which is the other half of the cost of living here.
- Enfield planning news: 35,162 homes proposed to 2041 and the inspector’s ruling on the Crews Hill green belt.
- Roads, roadworks and travel in Enfield.
- Things to do in Enfield.
Sources
- UK House Price Index, Enfield (ONS and HM Land Registry) for the borough average, property-type and buyer-type figures and the annual changes.
- HM Land Registry UKHPI open data for the July 2026 record, with the London and England benchmarks. The December 2022 peak comes from the same series. Monthly sales volumes come from the UK HPI full data file.
- HM Land Registry Price Paid data for the outcode, sector, street and property-type medians, computed from 2,470 residential sales recorded in the Enfield district completing between 1 July 2025 and 30 June 2026.
- Postcode sectors are named from postcodes.io ward lookups on live postcodes in each sector; where a sector straddles a boundary the label describes the Enfield part only.
Land Registry figures are provisional and revised as more sales are registered, and the most recent months in any window are always the thinnest. Confirm the latest numbers against the linked sources before making a decision.
Have your say